What makes this different
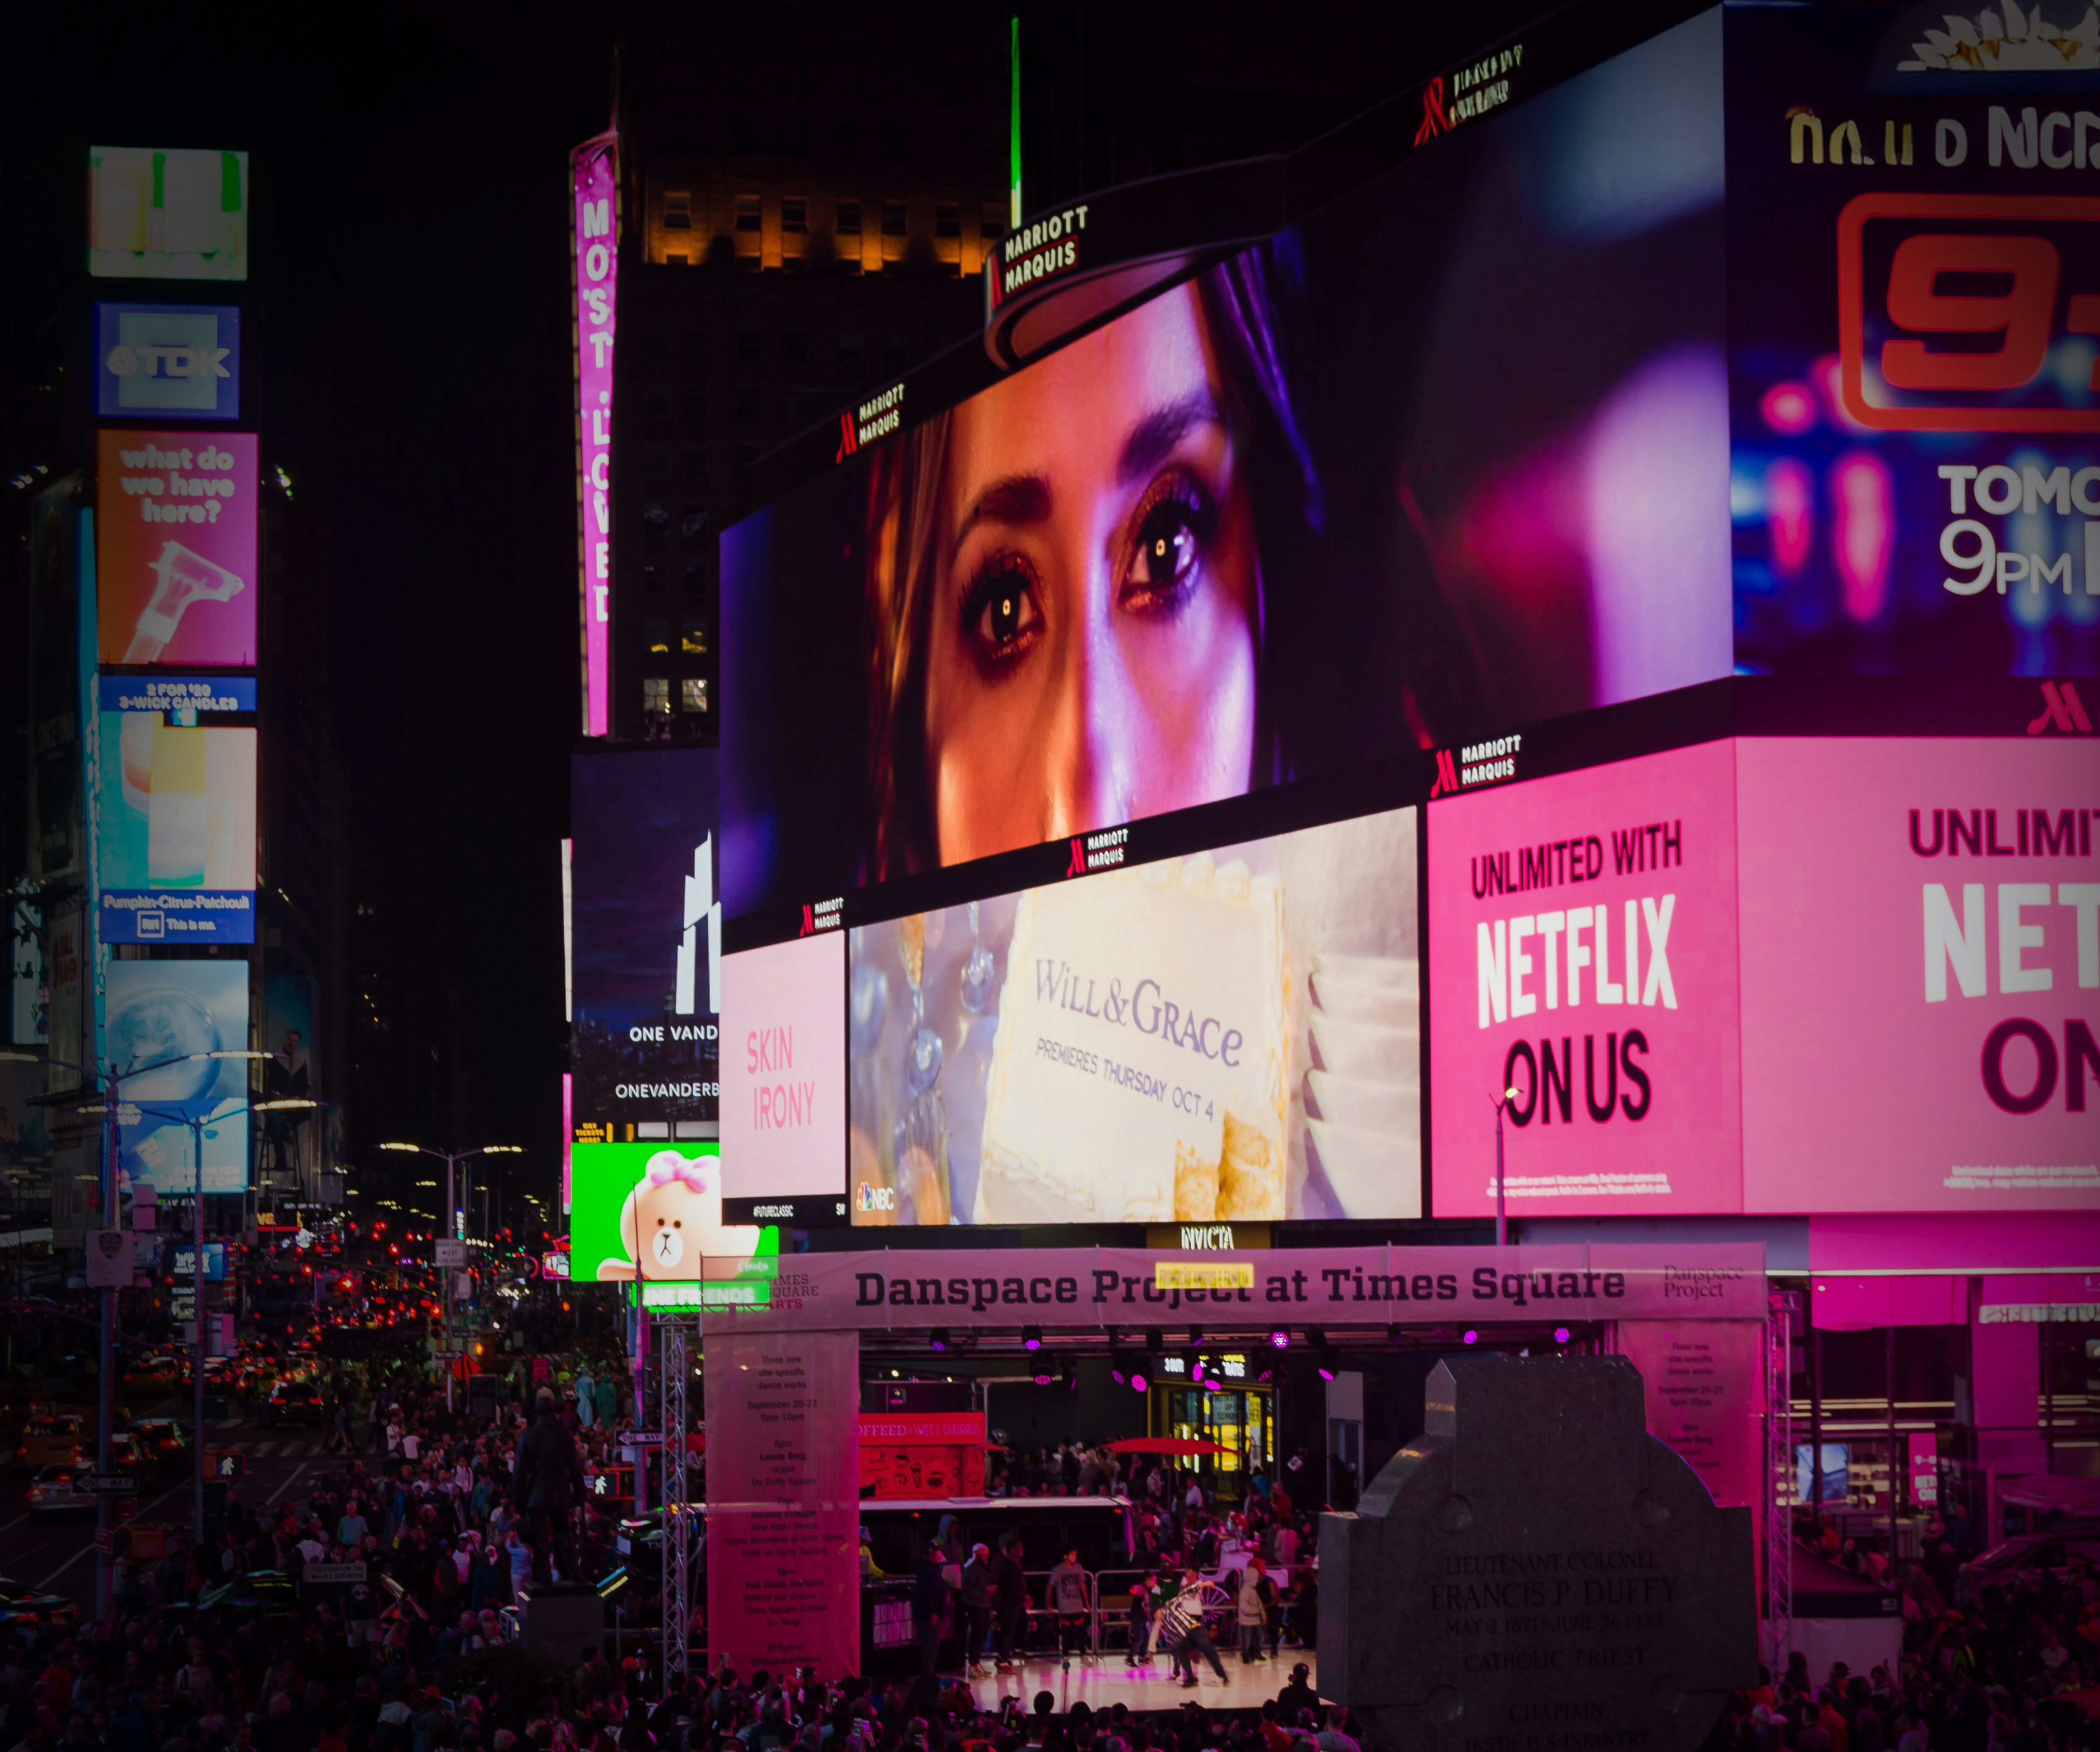
Interact
Now
Now
Scan to control this website
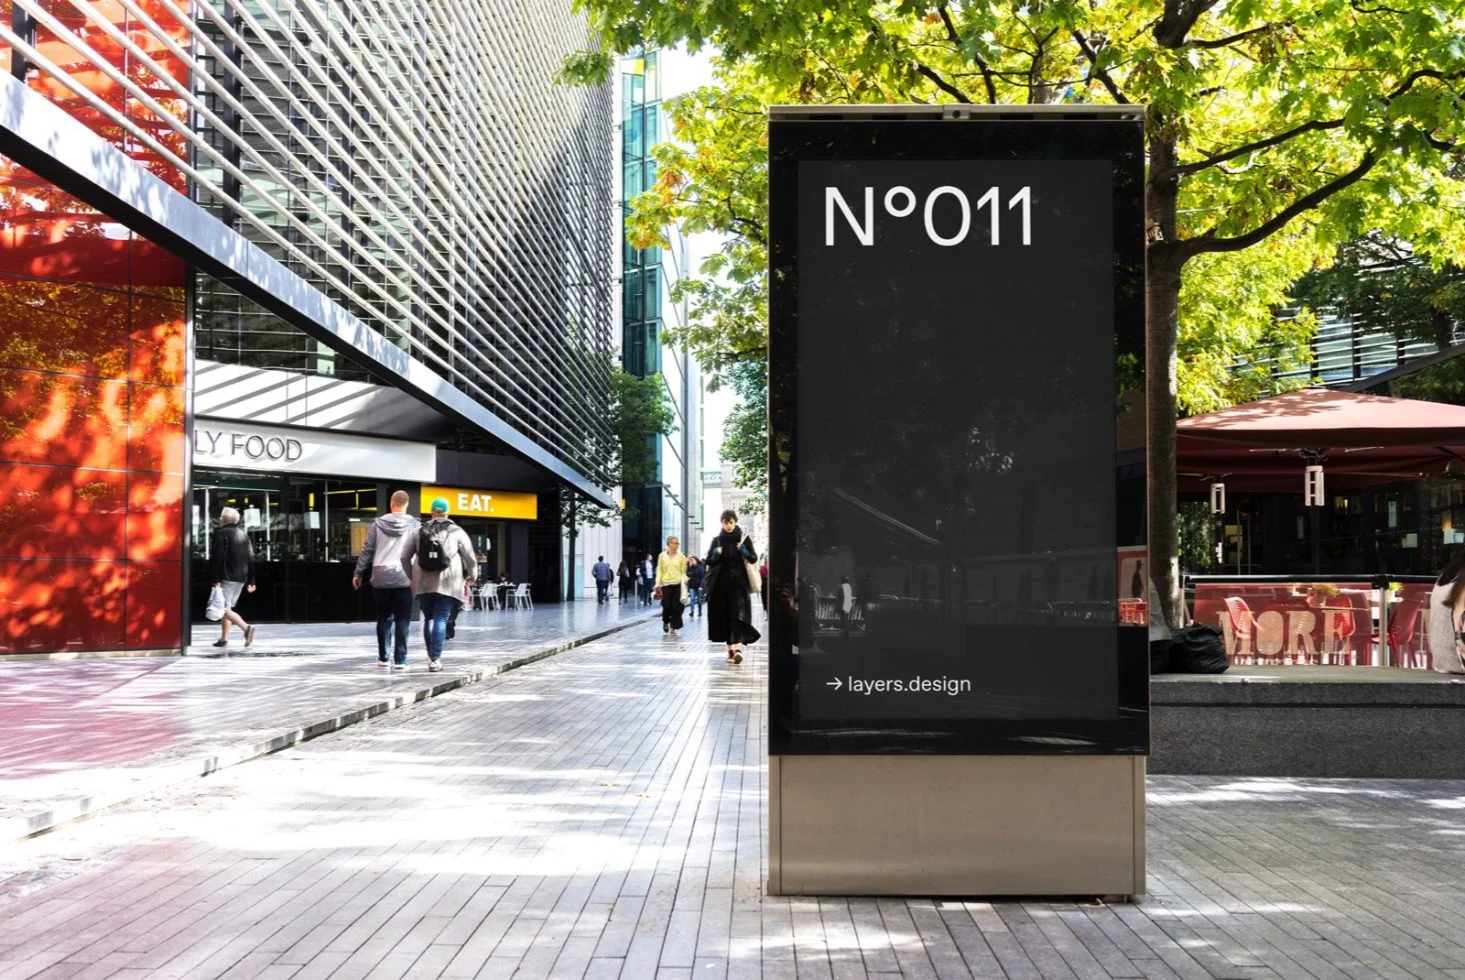
Interact
Now
Now
Scan to control this website
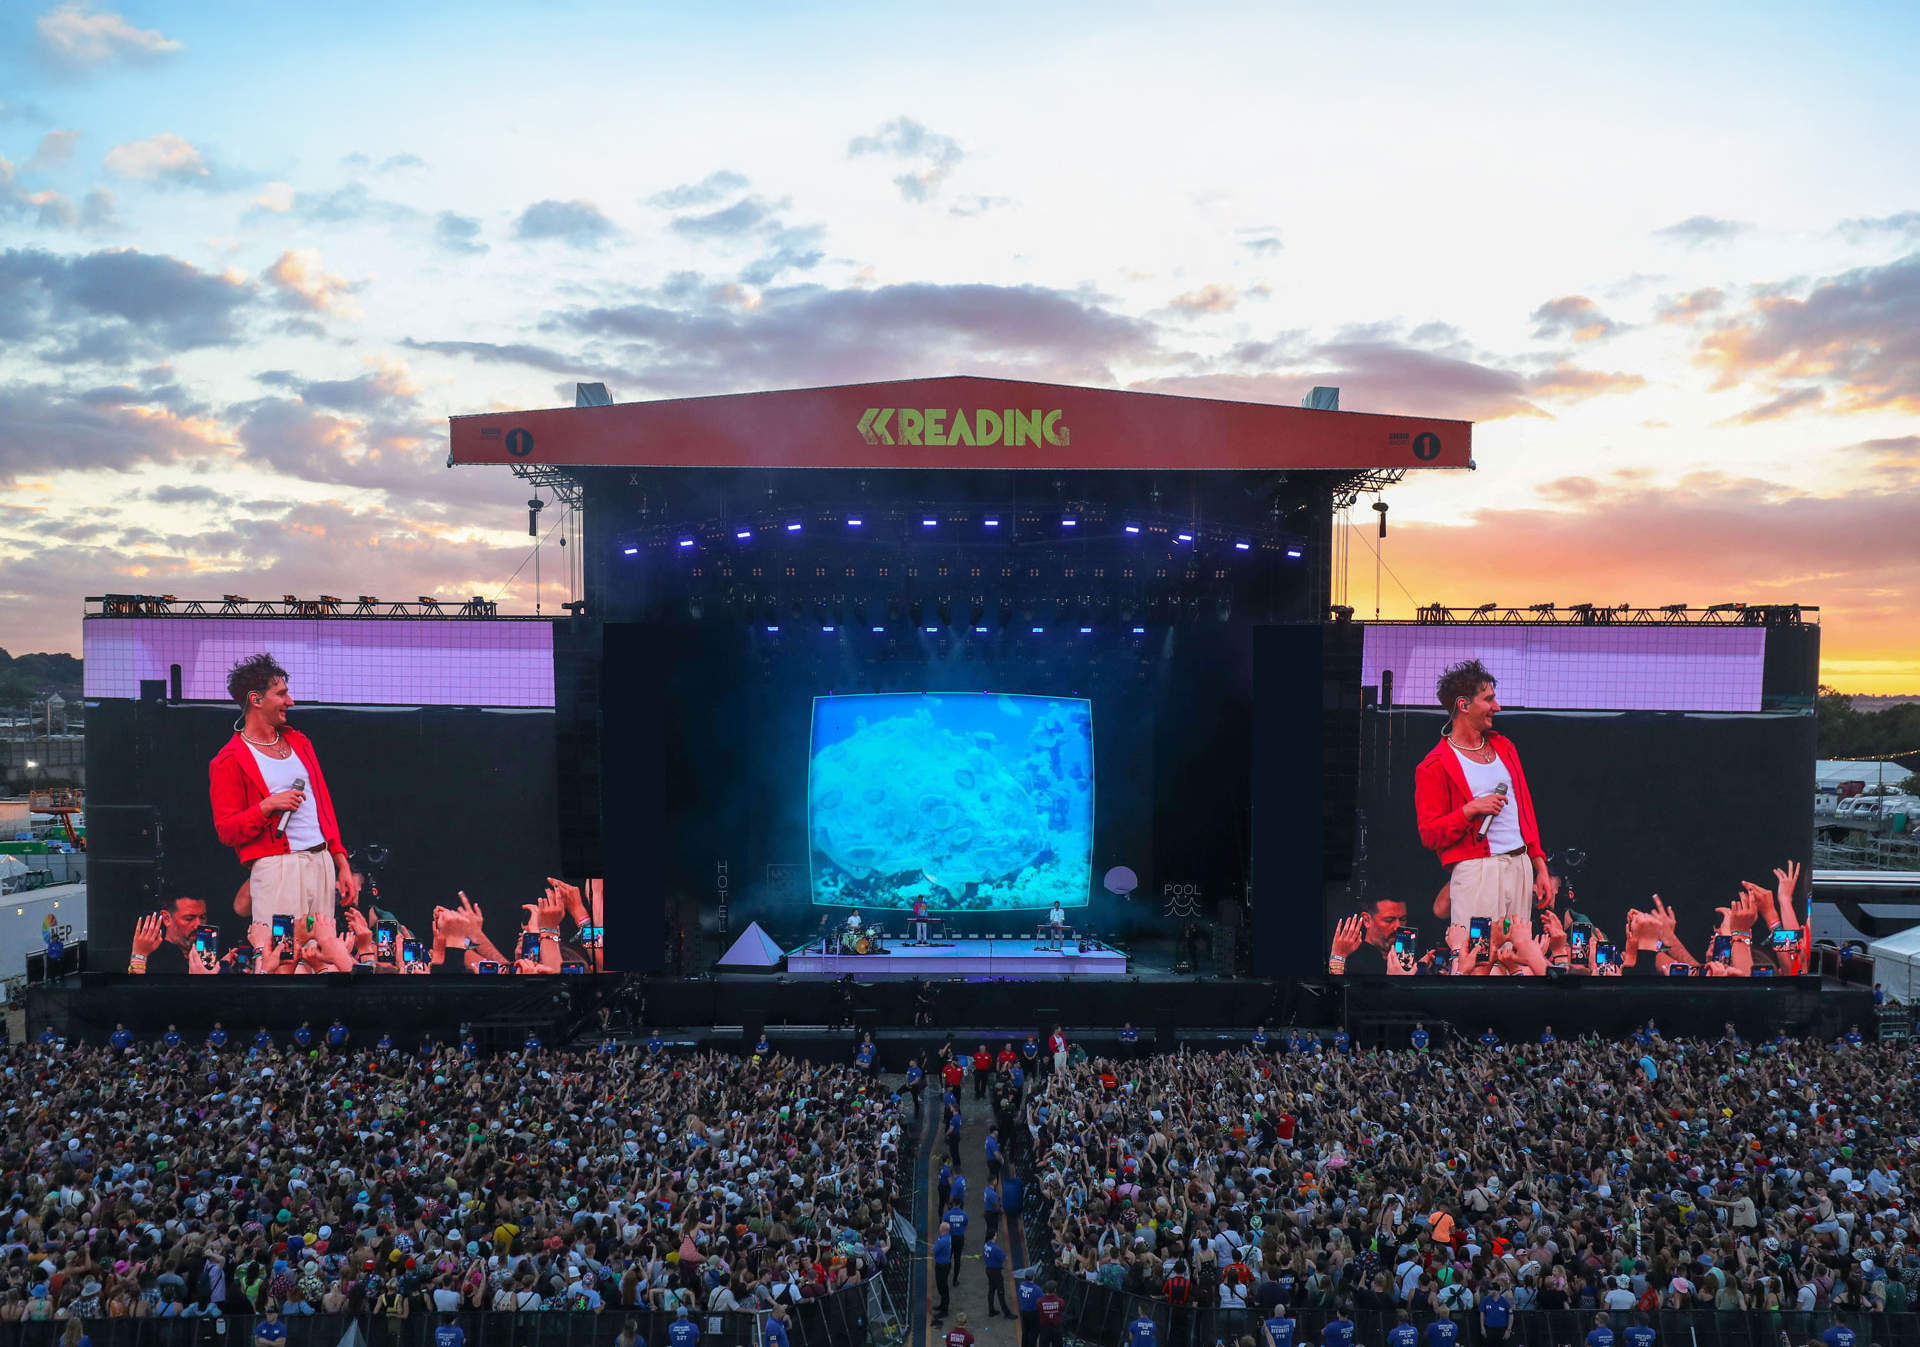
Interact
Now
Now
Scan to control this website
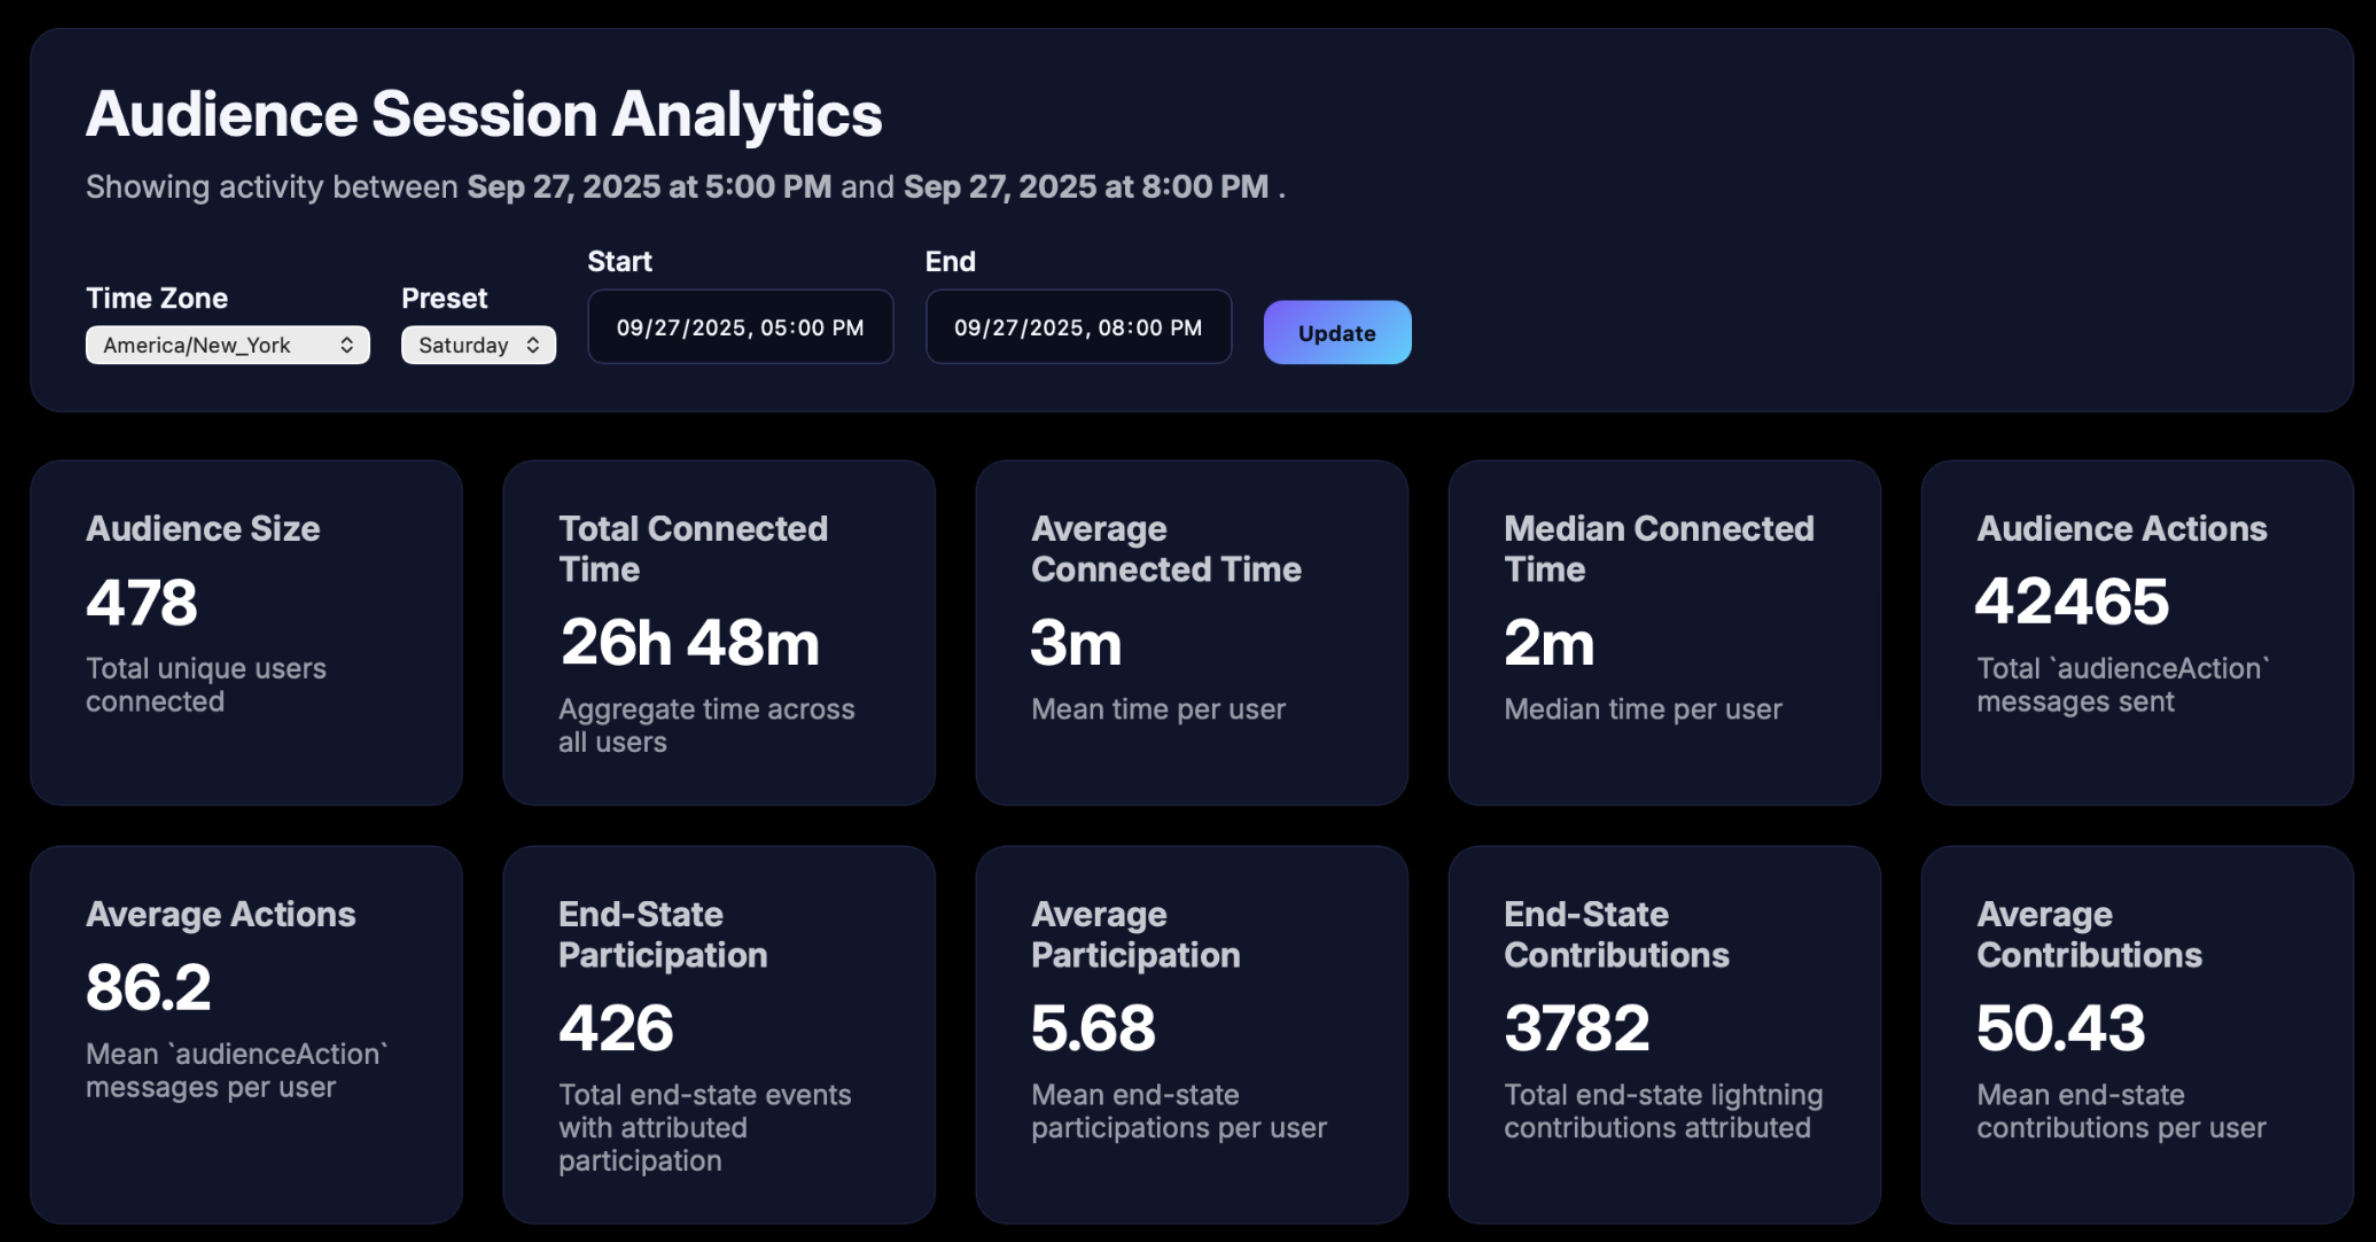
Every activation generates a full data trail
Brands can dial depth up or down depending on what they need.
1
Aggregate ROI metrics
2
Demographic and behavioural data
3
First-party opt-in data
Trusted by leading brands and events
7,113 Participants
93,683 Individual actions rendered in real time
91% Repeat participation rate
307hrs Collective dwell time
Super Bowl LX — San Francisco Ferry Building, February 2026. Independently documented by the University of Southampton.
 Australian Open
 ROI-driven brand engagement at Grand Slam scale
 TED AI
 In-room and YouTube livestream audiences participating simultaneously
 Microsoft / Outside Lands
 AI-powered artist tools embedded into a headline festival set


Planning an activation?
Thanks — we'll be in touch shortly.
Not ready to brief yet? See all case studies →